Pyramid Analytics

With Pyramid Analytics, you put your data strategy at the center. Pyramid Analytics adapts to your needs and works with the existing IT infrastructure.

What Is the Advantage of Pyramid Analytics?

Pyramid Analytics OS is an adaptable analytics platform that provides information and analysis tools individually based on user needs and capabilities while managing all content as a common resource. It thereby offers companies a company-wide analysis solution for all users. With the Pyramid Analytics OS, companies are prepared for the future data and technology challenges of digital transformation.

pyramid analytics uebersicht 1

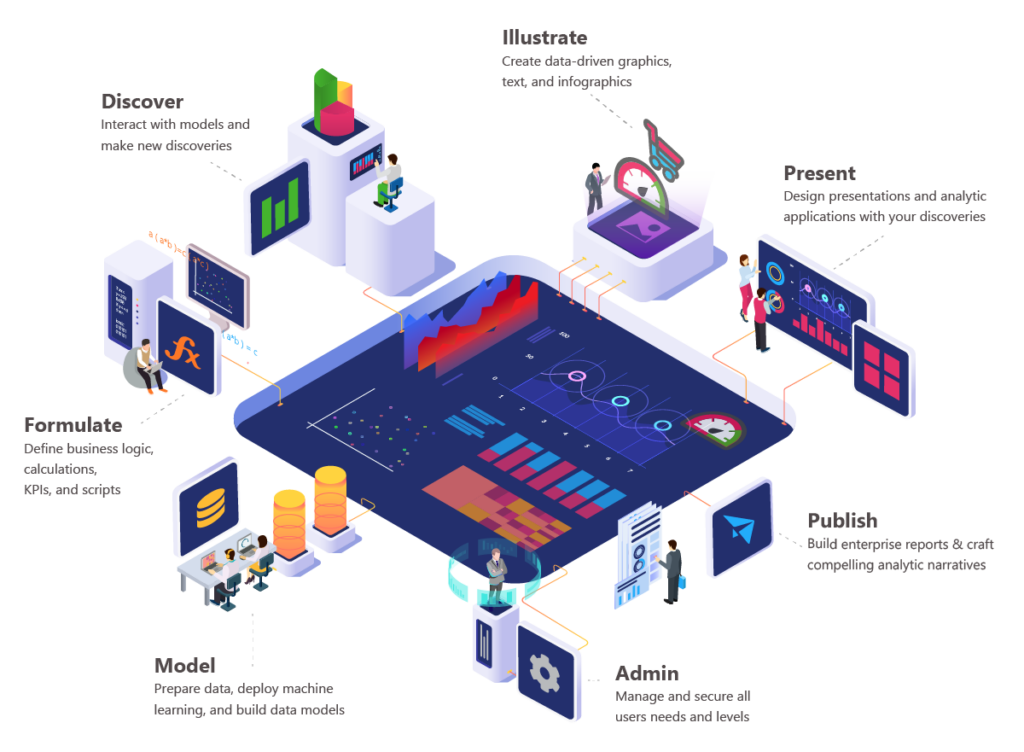
Pyramid Analytics is an analytics platform that can be used in any environment and runs on any device. It includes six different analytics modules (Model, Formulate, Discover, Illustrate, Present, and Publish), as well as a management console and content management system to provide a truly universal analytics experience.

Modeling

Prepare data, use machine learning, and build data models

pyramid analytics model image 1

Pyramid Analytics’ innovative approach: Business User ETL – a visual point-and-click environment for correcting, preparing and improving simple and mixed data sets.

KEY FEATURES

  • Automatic end-user modeling and data preparation
  • Insert machine learning algorithms into pre-modeling datasets
  • Machine learning marketplace for finding and using existing data science algorithms.
  • In-memory database engine
  • Modeling on the native Pyramid in-memory engine, MS Tabular, many ANSI SQL-compliant databases or a variety of Apache Big Data Engines

Pyramid Analytics empowers IT professionals, BI power users, and data scientists to solve difficult analytical problems with a set of advanced yet easy-to-use tools.

KEY FEATURES

  • Fast query processing for large amounts of data
  • Intuitive drag-and-drop features
  • Attractive visualizations
  • Powerful statistical analysis tools
  • Advanced analytics using a wizard

Discovery

Interact with models and make new discoveries

pyramid analytics discover 1

Formulate - Integration of Business Logic

Define business logic, calculations, KPIs, and scripts

pyramid analytics formulate 1

With Pyramid Analytics, users can create custom expressions, lists, KPIs, parameters, scripts, and custom columns with an intuitive drag-and-drop interface, and then share and manage these new building blocks so that others can use them for their own analysis.

KEY FEATURES

  • Drag&drop creation of expressions, calculations and extended parameters
  • Secure, share, and reuse business logic
  • Dynamic records with branching logic
  • Out-of-the-box aggregates, operators and functions
  • Dynamically data-bound KPIs

With the Pyramid Analytics Illustrate module, users can create visual BI building blocks to build libraries of data-driven illustrations, infographics, and dynamic text that can be shared and reused in presentations and publications.

KEY FEATURES

  • Dynamic infographics
  • Reusable, distributable content for presentations and publications
  • Data-driven dynamic text
  • Composite visualizations (layered SVG and raster images)
  • Custom visual workflows to demonstrate processes

Illustrate - Visualizations

Create data-driven graphics, text, and infographics

pyramid analytics illustrate 1

Present

Design presentations and analytical applications for dynamic analysis results

pyramid analytics present 1

Pyramid Analytics provides users with tremendous opportunities to create presentations from disparate data sources and guide others through a rich and highly interactive data-driven environment.

KEY FEATURES

  • Robust design control
  • Master Page Support
  • Fully interactive visualizations
  • mobile design
  • Interactions and joint slicing across multiple queries and data sources

The Pyramid Analytics Publish module enables end users to design and create engaging, dynamic, multi-page reports or reports with multiple queries. They use the same platform that they use to prepare data models and perform advanced analysis queries. In conjunction with data-driven planning and distribution, Publish is a modern corporate reporting system.

KEY FEATURES

  • Pixel-perfect reporting
  • State-of-the-art design control
  • Master Page Support
  • Time-controlled distribution of “high capacity” reports
  • Dynamic reporting with secure access

Publish - Reporting

Create company reports and create compelling analytical stories.

pyramid analytics publish 1

Administration

Control every aspect of your Analytics OS deployment

pyramid analytics administer 1

With Pyramid Analytics, the analytics environment can be tailored to the needs of the business and of each user. Experience true enterprise BI and make data more valuable than ever.

KEY FEATURES

  • Easy scaling
  • Data source management
  • Optimize performance
  • Easy user provisioning and management
  • Universal Visual The

Pyramid Analytics Offers Existing Integrations to

How to Start?

Free consulting & demo appointments

Do you already have a strategy for your future BI solution? Are you already taking advantage of modern analytics platforms? Learn with us how you can develop a strategy for the introduction of a BI solution and how our customers use agile and scalable BI solutions.

Trainings / Courses

Our classroom, online, and mobile training courses provide you with the know-how you need to use Pyramid Analytics software productively. The areto Data Analytics TrainingCenter offers a wide range of learning content. We create individual training and coaching sessions for you, effectively preparing your users to work with the BI solutions in your company.

Proof of Concepts

Is Pyramid Analytics right for you? Are the framework conditions suitable for it? What prerequisites need to be created? Proof of Concepts (POCs) aim to answer these and other questions in a short time in order to make the right investment decisions based on in-depth knowledge. With our PoC best practices, you start your project well prepared.


Help for self-help -
areto consultation hours

Book a support appointment with one of our Pyramid Analytics experts!  Quick solution approaches and best-practise to your concrete problems in dealing with the powerful Business Intelligence solution!

Costs

0,5 hours – 110 €
1,0 hours – 200 €
2,0 hours – 350 €

Pyramid Analytics consultation

The Pyramid Analytics consultation hour offers you the opportunity to receive short-term support for small and large questions. Benefit from the experience of our experts in solving your problem. This way, you can quickly get back to your actual work.

Leverage your data. Discover opportunities. Gain new insights.

We look forward to hearing from you

Daniel Olsberg 1

Daniel Olsberg
Director Business Development
Phone: +49 221 66 95 75-0
E-mail: Daniel.Olsberg@areto.de